
Global Strategic Outlook 2027 · Chapter 6 of 10
Chapter 6. The 2027 signpost dashboard
Twenty indicators, fixed definitions, pre-committed thresholds.
Bruno Hounkpati, Founding Partner and Chief Executive Officer
20 October 2026
Chapter 6
The 2027 signpost dashboard: twenty indicators, fixed definitions, pre-committed thresholds
The year opens on an energy shock layered over a managed trade rivalry, not the geoeconomic confrontation the January 2026 expert survey ranked first. Twenty public readings, each with its definition fixed and its threshold decided in advance, say when that has changed and which decisions in this edition the change reopens.
- The decision: which twenty public indicators, read on a fixed date each quarter, tell the chief executive that the environment has moved from one scenario to another, and which decisions in this edition that move reopens; owner, the chief executive with the chief financial officer, one named person recording the readings.
- What the evidence says: the year opens on an energy shock layered over a managed trade rivalry. Brent averaged an estimated 114 dollars in September 2026 and both reserve-currency central banks raised rates that month, while the tariff average held at 11.0 percent and activity surveys read above 50; activity lags price.
- The test: the dashboard itself, twenty readings against pre-committed thresholds and a majority rule for any scenario shift, with a one-paragraph verdict each quarter. The number the evidence lacks: the company's own exposure weight on each row, and a quarterly count for the trade-measures thread, which sat behind a human check on 21 October.
Decision at stake
Which twenty public indicators, read on a fixed date each quarter, tell the chief executive of a company of 30 to 500 million euros of revenue that the environment has moved from one of the edition's three scenarios to another, and which decisions in chapters 1 to 10 that move reopens. The owner is the chief executive with the chief financial officer; one named person records the readings. The dated moments are the end of each quarter and the fixed events between them: the Chinese export-control dates of 10 and 27 November 2026 and the tariff-truce end of 10 January 2027 (chapter 1); the first sale of carbon border certificates on 1 February 2027; the Senegalese creditor talks. The consequence of error runs both ways: a board that reads a headline as a regime change unwinds buffers on one data point; a board that waits for a consensus reads the shift two quarters late, in 2026 the distance between the conflict's opening in late February and the rate rises of September.
What the evidence shows
What changed, 2024 to 2026
The environment entering 2027 is an energy shock layered on a managed trade rivalry, not the geoeconomic confrontation that the January 2026 expert survey ranked first. The Energy Information Administration estimates that Brent averaged 114 dollars a barrel in September 2026, 23 dollars above August, and forecasts 105 dollars for the fourth quarter and 84 for 2027 (projections), citing attacks on a Saudi pipeline and "extreme tightness in diesel markets". The front-month Dutch gas contract stood at 86.28 euros per megawatt-hour on 20 October 2026 (secondary price page); European storage, at 28.06 percent of capacity on 1 April 2026, a four-year low for the date, stood at 74.62 percent on 20 October (operators' platform). The trade side is calmer: the American statutory tariff average stood at 11.0 percent on 24 August 2026 and the trade-measures database counted 445 interventions by 108 jurisdictions in its Iran-conflict thread; the IMF projects global growth of 3.1 percent in 2026 and 3.4 percent in 2027 with 4.7 percent headline inflation in 2026 (projections). CH06-C1
The two reserve-currency central banks raised rates in the same month. The European Central Bank raised its three key rates by 25 basis points on 10 September 2026, taking the deposit facility to 2.50 percent, stating that "the conflict in the Middle East continues to generate inflation pressures" and with staff projecting headline inflation at 3.0 percent in 2026 and 2.5 in 2027 (projections); the Federal Open Market Committee raised its target range to 3.75 to 4.00 percent on 16 September, its only move of 2026 so far. The two authorities that matter most in the francophone African arena did not follow: the BCEAO held its main rate at 3.00 percent on 9 September, with UEMOA inflation at 0.4 percent and growth at 6.0 percent in the second quarter, and Bank Al-Maghrib held Morocco's at 2.25 percent on 22 September (press). CH06-C2
On this edition's reading, in 2026 activity indicators moved after price indicators. The euro area composite output index stood at 53.1 in September 2026, a 41-month high, while an economist at the survey publisher said renewed price pressures point to inflation nearer 4 percent than the ECB's 2 percent goal. France's composite read 51.1 after 48.5 in August, while its manufacturers reported new orders falling for a fifth month, export orders for a ninth and supplier delivery times that "lengthened substantially", and services selling prices rose at the fastest rate in more than three years. On the monthly series the euro area index fell below 50 in April and May 2026, after Brent's 45 percent rise in March, and was above it again by July (Exhibit 6.1). CH06-C3
Price leads activity, on this edition's reading: Brent, European gas and the euro area composite output index, January 2025 to September 2026
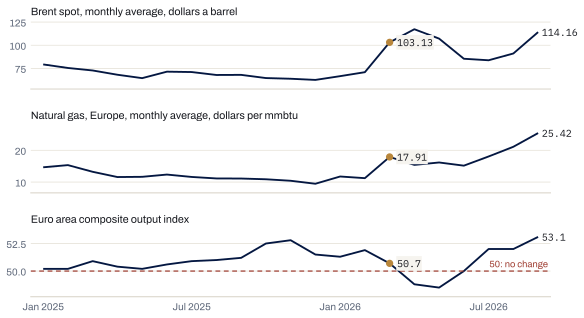
March 2026 marked: Brent rose 45 percent on the month and the output index fell below 50 in April and May before recovering; each series sits on its own axis.
Source · EIA, Europe Brent spot price, monthly (release of 15 October 2026); World Bank, Pink Sheet, Natural gas, Europe (April 2025 to October 2026 editions); HCOB and, from March 2026, S&P Global, Eurozone Composite PMI final releases · read 2026-10-21 · SEG-1
Show the underlying numbers
| Item | see panel titles | Series |
|---|---|---|
| 2025-01 | 79.27 | brent |
| 2025-01 | 14.66 | gas |
| 2025-01 | 50.2 | pmi |
| 2025-02 | 75.44 | brent |
| 2025-02 | 15.34 | gas |
| 2025-02 | 50.2 | pmi |
| 2025-03 | 72.73 | brent |
| 2025-03 | 13.24 | gas |
| 2025-03 | 50.9 | pmi |
| 2025-04 | 68.13 | brent |
| 2025-04 | 11.59 | gas |
| 2025-04 | 50.4 | pmi |
| 2025-05 | 64.45 | brent |
| 2025-05 | 11.66 | gas |
| 2025-05 | 50.2 | pmi |
| 2025-06 | 71.44 | brent |
| 2025-06 | 12.37 | gas |
| 2025-06 | 50.6 | pmi |
| 2025-07 | 71.04 | brent |
| 2025-07 | 11.62 | gas |
| 2025-07 | 50.9 | pmi |
| 2025-08 | 67.87 | brent |
| 2025-08 | 11.15 | gas |
| 2025-08 | 51.0 | pmi |
| 2025-09 | 67.99 | brent |
| 2025-09 | 11.12 | gas |
| 2025-09 | 51.2 | pmi |
| 2025-10 | 64.54 | brent |
| 2025-10 | 10.89 | gas |
| 2025-10 | 52.5 | pmi |
| 2025-11 | 63.80 | brent |
| 2025-11 | 10.42 | gas |
| 2025-11 | 52.8 | pmi |
| 2025-12 | 62.54 | brent |
| 2025-12 | 9.48 | gas |
| 2025-12 | 51.5 | pmi |
| 2026-01 | 66.60 | brent |
| 2026-01 | 11.76 | gas |
| 2026-01 | 51.3 | pmi |
| 2026-02 | 70.89 | brent |
| 2026-02 | 11.24 | gas |
| 2026-02 | 51.9 | pmi |
| 2026-03 | 103.13 | brent |
| 2026-03 | 17.91 | gas |
| 2026-03 | 50.7 | pmi |
| 2026-04 | 117.29 | brent |
| 2026-04 | 15.41 | gas |
| 2026-04 | 48.8 | pmi |
| 2026-05 | 107.14 | brent |
| 2026-05 | 16.17 | gas |
| 2026-05 | 48.5 | pmi |
| 2026-06 | 85.40 | brent |
| 2026-06 | 15.17 | gas |
| 2026-06 | 50.0 | pmi |
| 2026-07 | 83.76 | brent |
| 2026-07 | 18.06 | gas |
| 2026-07 | 52.0 | pmi |
| 2026-08 | 91.08 | brent |
| 2026-08 | 21.11 | gas |
| 2026-08 | 52.0 | pmi |
| 2026-09 | 114.16 | brent |
| 2026-09 | 25.42 | gas |
| 2026-09 | 53.1 | pmi |
The three text-based indices on the dashboard measure attention, not events. The ECB states that the unadjusted trade policy uncertainty index "tends to be highly volatile" and may capture policy changes and media attention as well as uncertainty shocks; on its adjusted measure the 2025 rise is associated with about 0.3 percentage points less euro area growth. The unadjusted index read 261 in September 2026 against 1,151 in April 2025. The World Uncertainty Index counts the word "uncertainty" in one publisher's country reports: its simple average fell from a peak of 56,813 in the third quarter of 2025 to 43,566 a year later, a fall that continued through the quarters of the oil shock (Exhibit 6.2). The geopolitical risk index counts adverse-event articles in ten newspapers; its monthly value reached 330 in March 2026, the conflict's first full month, then stood at 126 in August and 146 in September. Its provisional daily values are revised, so only monthly values are printed. Its authors report that it "foreshadows lower investment and employment"; the one independent reading found, a June 2026 column, calls it a tool for interpreting events rather than forecasting. CH06-C4
An attention gauge, not a leading indicator: the World Uncertainty Index while the oil shock ran
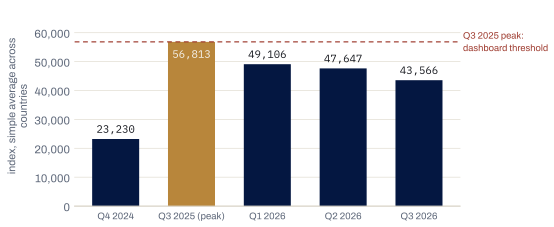
The index fell through 2026 while Brent averaged an estimated 114 dollars a barrel in September 2026: it records analyst language, not events, which is why the dashboard pairs it with hard series.
Source · Ahir, Bloom and Furceri, World Uncertainty Index, via FRED (updated 15 Oct 2026) · read 2026-10-20 · SEG-1
Show the underlying numbers
| Item | index, simple average across countries |
|---|---|
| Q4 2024 | 23,230 |
| Q3 2025 (peak) | 56,813 |
| Q1 2026 | 49,106 |
| Q2 2026 | 47,647 |
| Q3 2026 | 43,566 |
A threshold is only as good as the definition under it. The same American tariff burden reads 11.0 percent on the statutory definition (24 August 2026), 10.85 percent as an effective rate before importers substitute away from taxed goods and 9.05 percent after substitution (the tariff model's July 2026 vintage) (Exhibit 6.3); in April 2026 the pre-substitution figure moved from 11.0 to about 11.8 percent in six days as Section 232 metal rates changed. A threshold at 12 percent would be crossed or missed on the definition alone, so the dashboard fixes the statutory definition for row 1 and writes one into every row. CH06-C5
One rate, three definitions: the US average tariff rate in the summer of 2026
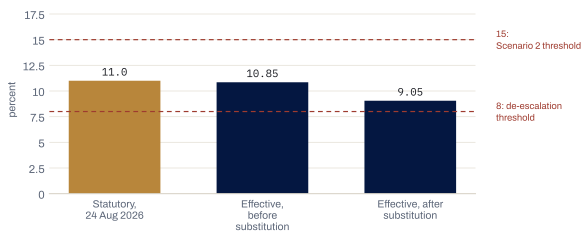
The dashboard fixes the statutory definition. The effective rates move with the import mix, so the same policy can read two points apart on the same day.
Source · The Budget Lab at Yale, tariff model improvements (20 Jul 2026) and The State of U.S. Tariffs (24 Aug 2026) · read 2026-10-20 · SEG-1
Show the underlying numbers
| Item | percent |
|---|---|
| Statutory, 24 Aug 2026 | 11.0 |
| Effective, before substitution | 10.85 |
| Effective, after substitution | 9.05 |
A threshold is only as good as the definition under it.
Low counts can mean low reporting, and rows are not independent. The International Maritime Bureau recorded 51 piracy and armed-robbery incidents from January to September 2026 against 116 a year earlier, the lowest nine-month figure since 1992, yet crew affected rose to 105 from 72, and the Gulf of Guinea's count of two depends on what shipowners report, so it is paired with a severity measure. On the Suez row, 36 percent of the capacity routed through either the canal or the Cape passed through Suez in the first two weeks of October 2026, and a liner analyst expects a full return by the first quarter of 2027 (press). The freight-index compiler (secondary page) names a faster Suez return as the biggest risk to carriers' planned rate increases: a crossing on the Suez row is expected to be followed by the freight row and, through fuel and freight, by the price rows, so the rows are read in clusters. CH06-C6
In the francophone African arena the sovereign rows read sharpest. Senegal's public debt was reassessed at about 130 percent of GDP after undeclared borrowing surfaced in 2024 and a 2.2 billion dollar IMF programme is negotiated but not approved (press); its bonds were "bidding in the low fifties" cents on 11 September 2026 and a bondholder group holding about 2.2 billion of 5.2 billion dollars outstanding wrote to Dakar in mid October (press), when a US Treasury under secretary said Washington wants the restructuring finished within a year. In the same market Côte d'Ivoire priced a 1.3 billion dollar fifteen-year Eurobond on 18 February 2026 at 5.39 percent in euros after hedging (press, relaying the finance ministry) and Morocco raised 2.25 billion euros on 19 May 2026. Computed by the edition from an aggregator's indicative closes of 19 and 20 October, the 2033 dollar bonds yield about 20 percent for Senegal, 7.0 for Côte d'Ivoire and 6.2 for Morocco; only Senegal is beyond the 12 percent line. CH06-C7
What is contested
The first objection is that expert risk lists already do this job. The long-run study of expert political judgment found that experts performed only slightly better than casually informed readers; the January 2026 survey of more than 1,300 experts ranked geoeconomic confrontation first over two years, and the realised 2026 shock was a Middle East war. A ranking is not a trigger.
The second objection is that the dashboard is a forecast dressed as a reading frame, with rows and thresholds chosen by judgment. Conceded, and printed so it can be disputed: every threshold is graded SEG-0, every reading SEG-1, and the early 2028 retrospective will say which rows crossed and what that reopened.
The third objection is that the September high shows no dashboard was needed. The same series fell below 50 in April and May, and the September releases show orders falling, delivery times lengthening, selling prices rising. A board that waits for activity to turn has already paid the price rows.
The corridor
What we expect in 2027
First, Brent's 2027 average lands between 80 and 95 dollars a barrel, around the EIA's base case of 84, and the front-month Dutch gas contract stays below 100 euros per megawatt-hour in every month; the energy shock unwinds without a second closure. Falsified if the 2027 Brent average falls outside 80 to 95 dollars, if any quarterly Brent average exceeds 110 dollars, if the monthly average gas price exceeds 100 euros in any month, or if the Suez share of Suez-or-Cape capacity falls back below 20 percent. Baseline hypothesis (Scenario 1). CH06-H1
Second, in the first quarter of 2027 no row crosses its Scenario 2 threshold except row 2, whose quarterly additions could not be read and are not predicted here, so the quarter reads "managed rivalry, unwinding shock" and the dashboard reopens nothing in chapters 1 to 10 beyond the sourcing audit tied to row 2. Falsified if any of rows 1, 5, 7 and 10 crosses its Scenario 2 threshold in the first quarter of 2027. Baseline hypothesis (Scenario 1). CH06-H2
Third, at least two of the metals-and-power rows (8, 9 and 11) cross upward during 2027 while rows 1, 2 and 7 stay inside their bands, so the tight-systems scenario is the live alternative to the baseline and hard decoupling is not. Falsified if fewer than two of rows 8, 9 and 11 cross by the fourth quarter of 2027, or if any of rows 1, 2 and 7 crosses upward in the same quarter as the metals rows. Live-alternative hypothesis (Scenario 3). CH06-H3
Signposts
| Indicator | Definition fixed | Reading, date · status, 21 October 2026 | Threshold | Crossing means |
|---|---|---|---|---|
| 1. US average tariff rate (Trade) | statutory average, Budget Lab definition, not the effective rate; at each policy change | 11.0 percent, 24 August 2026; 11.8 projected end 2026 · inside | above 15 percent for a full quarter; or below 8 | up: Scenario 2, re-price US-bound exports (chapter 1); down: revisit postponed US investment |
| 2. Trade interventions, 2026 Iran-conflict thread (Trade) | Global Trade Alert thread count from 28 February 2026; continuous | 445 interventions by 108 jurisdictions, 20 October 2026; quarterly count behind a human check on 21 October · not read for the quarter | more than 100 added in a quarter | up: Scenario 2; audit export-control and subsidy exposure by sourcing country |
| 3. Trade policy uncertainty index (Attention) | monthly share of articles in seven US newspapers, authors' spreadsheet; ECB-adjusted measure as a cross-check | 261, September 2026; peak 1,151, April 2025; updated 1 October 2026 · inside | above the early-2025 peak in the spreadsheet | a trade shock comparable to 2025; the ECB's 0.3-point growth effect becomes the planning case |
| 4. Geopolitical risk index (Attention) | monthly share of adverse-event articles in ten newspapers, benchmark series (column GPR of the authors' spreadsheet); daily values not used | 146, September 2026; 126, August; 330, March; updated 1 October 2026 · beyond, below 150 in August and September | above 250 for two months; or below 150 | up: hold energy hedges and buffers; down: unwind buffers (chapter 3) |
| 5. Suez share of Suez-or-Cape container capacity (Logistics) | share of Suez-or-Cape capacity through the canal, weekly, shipowners' association via press | 36 percent; 753,000 TEU a week, 52 percent of 2023, first two weeks of October 2026; IMF transit cross-check, 187 container transits, 63 percent of the same days of 2023 · inside | above 60 percent; or below 20 | up: Scenario 1, shorter transit times make transit buffers less necessary; down: Scenario 2, reopen the 2024 contingency plan |
| 6. World Container Index composite (Logistics) | freight-index compiler, weekly, dollars per forty-foot unit | 4,485 dollars, 15 October 2026 (secondary page) · inside | above 5,000; or below 2,500 | up: landed-cost repricing for Arena B importers; down: renegotiate annual contracts |
| 7. Brent, monthly average (Energy) | EIA Short-Term Energy Outlook, monthly | 114 dollars, September 2026 (estimate); daily 126.55 on 14 October · at threshold on the monthly, quarterly pending | quarterly average above 110; or below 80 | up: Scenario 2, fuel subsidies and current accounts in Arena B under strain; down: the 2027 base case holds |
| 8. LME copper, three-month close (Metals) | London Metal Exchange, daily, dollars per tonne | 14,339, data valid 19 to 20 October 2026 · inside | above 15,000; or below 11,000 | up: Scenario 3, raise capex contingencies on electrical inputs; down: demand slowdown |
| 9. Lithium carbonate and cobalt (Metals) | China spot battery-grade carbonate via aggregator; LME cobalt three-month; daily | 102,350 yuan a tonne; 34,620 dollars a tonne, 20 October 2026 · inside on price; quota not read | lithium above 150,000 yuan; cobalt above 40,000 dollars or any change to Congolese export quotas | Scenario 3: battery-chain input costs re-enter the 2022 upswing (chapter 2) |
| 10. TTF front month and EU gas storage (Energy) | front-month contract, euros per MWh; storage operators' filling level; daily | 86.28 euros, 20 October 2026 (secondary); storage 74.62 percent, 20 October (operators' platform) · inside | gas above 100; or storage below 70 percent on 1 November | Scenario 2: 2022-type stress for energy-intensive plants in Arena A; Moroccan and West African import costs follow (chapter 4) |
| 11. Data-centre electricity, IEA 2030 base case (Energy) | IEA Energy and AI series, annual | 485 TWh in 2025 (estimate); about 950 TWh by 2030 (projection) · inside | 2030 figure revised above 1,000 or below 800 TWh | up: Scenario 3, grid and transformer scarcity persists; down: the AI capital cycle cooling (chapter 5) |
| 12. EUR/USD, EUR/CNY, CFA franc peg (Money) | ECB reference rates, daily; Treasury parity statement, event-driven | 1.1215 dollars, 20 October 2026; 7.5240 yuan, 16 October; parity 655.957 FCFA, no reform item found · inside | below 1.05 or above 1.20; EUR/CNY below 7.30; any official communiqué on parity or guarantee | euro strength compresses Arena A exporters and cheapens Arena B imports; a CFA communiqué changes every XOF contract |
| 13. Policy rates: BCEAO, Bank Al-Maghrib, ECB deposit, Fed (Money) | official rate tables, in percent; quarterly or six-weekly | 3.00 (held 9 September); 2.25 (held 22 September, press); 2.50 (raised 10 September, effective 16 September); 3.75 to 4.00 (raised 16 September, effective 17 September 2026) · inside | ECB deposit 3.00; BCEAO 3.50 or above; Fed above 4.50 | tightening scenario: refinancing costs and XOF liquidity tighten within two quarters |
| 14. Sovereign status: Senegal, Côte d'Ivoire, Morocco (Arena B sovereign) | IMF programme and restructuring events, event-driven; primary issue terms; yields on the 2033 dollar bonds computed by the edition from an aggregator's indicative closes, at each reading | Senegal bonds in the low fifties (11 September, press), bondholder group 2.2 of 5.2 billion dollars (14 October, press); Côte d'Ivoire 5.39 percent in euros (18 February, press); Morocco 4.842 and 5.289 percent (19 May 2026); 2033 dollar bonds, yields computed from an aggregator's indicative closes of 19 and 20 October: about 20, 7.0 and 6.2 percent · Senegal beyond; Côte d'Ivoire and Morocco inside | Senegal agreement in principle, or none by end of the second quarter of 2027; any Eurobond yield above 12 percent | agreement: the regional sovereign market reopens; none: arrears and bank-sovereign stress in Dakar spill into the regional market |
| 15. ECOWAS-AES trade regime; Gulf of Guinea piracy (Arena B corridors) | official communiqués via press; IMB quarterly counts with crew affected | framework talks opened 17 October 2026; 2 incidents January to September 2026 · inside | common external tariff applied to AES-bound goods; more than 10 incidents in a quarter | tariff application re-prices the Lomé, Abidjan, Dakar and Cotonou corridors to the Sahel (chapter 3); a piracy rebound raises war-risk premia |
| 16. EU carbon border dates and allowance price (Regulation) | EUR-Lex dates; Commission quarterly certificate price; allowance price via aggregator, daily | certificates 75.36, 75.28, 82.32 euros (Q1 to Q3 2026); sale 1 February 2027; surrender 30 September 2027; allowances 85.54 euros, 20 October 2026 · inside | allowances above 100 euros; or an act delaying the 1 February sale | up: the 2027 cash cost on 2026 imports exceeds budgets for steel, aluminium and fertiliser importers; delay: extend the working-capital plan |
| 17. World Uncertainty Index, simple average (Attention) | frequency of "uncertainty" in one publisher's country reports; quarterly via FRED | 43,566, third quarter of 2026, from a 56,813 peak in the third quarter of 2025 · inside | above the 2025 peak; or below 30,000 | up: a new uncertainty regime, delay irreversible capex; down: return toward 2024 conditions |
| 18. Container throughput, Tanger Med and Lomé (Arena B corridors) | port authority annual releases; Lomé via press until the authority publishes | 11,106,164 TEU (2025, up 8.4 percent); 2.4 million TEU (2025, up 16 percent, press) · not read; 2026 figures due early 2027 | 2026 below 2025 at either port | transshipment downturn in the western Mediterranean or the Gulf of Guinea; check hinterland demand and liner network changes |
| 19. Composite PMIs, euro area and France (Activity) | S&P Global output indices, monthly; flash around the 23rd | 53.1; 51.1, September 2026; October flash due 23 October · inside | euro area below 50 for two months; France below 48 | recession scenario in Arena A: order cancellations and longer delays in paying suppliers within one quarter |
| 20. Enterprise AI adoption, US businesses (Technology) | Census Bureau BTOS share using AI in any business function, biweekly | 23.8 percent, survey of 21 September to 4 October 2026; 19.8 in the survey to 3 May · inside, rising | above 25 percent; or flat below 20 for four periods | up: competitive pressure on service firms in Arena A (chapter 5); flat: AI capital expectations overstated, read with row 11 |
A shift is declared when a majority of the rows tagged to a scenario cross toward that scenario in the same quarter, never on one headline: Scenario 2 when at least three of rows 1, 2, 5, 7 and 10 cross toward it (rows 1, 2 and 7 above their upper thresholds, row 10 on either of its lines, row 5 below 20 percent); Scenario 3 when at least two of rows 8, 9 and 11 cross upward while rows 1, 2 and 7 hold; Scenario 1 when rows 5 and 7 both cross toward it (row 5 above 60 percent, row 7 below 80 dollars) while row 19 holds. Rows read after the quarter closes (7, 15 and 17) use the last complete quarter. Rows 3, 4 and 17 are attention gauges paired with rows 1, 7 and 5 respectively and never count on their own. Row 4, below its lower line, does not count alone while its pair, row 7, sits at its upper one: the buffers stay until Brent's quarterly average decides.
The two arenas
Francophone Europe. A French or Belgian importer of Moroccan fertiliser or Turkish steel above the 50-tonne threshold faces its first cash outlay for 2026 volumes in 2027, at the published certificate prices of 75.36 to 82.32 euros. A Rotterdam or Antwerp importer reads the Suez row as the end of a detour that added about 10 percent to global container-ship demand (shipowners' association via press). An energy-intensive plant in France reads row 10 against the refill.
Francophone Africa. For a company in Dakar the signpost is binary, an agreement in principle with Senegal's creditors or arrears, in a union whose debt service reached 83 percent of tax revenue in 2025 (IMF via press). For a Lomé or Abidjan logistics operator the question is whether the common external tariff is ever applied to goods bound for Bamako, Ouagadougou or Niamey; the first ECOWAS-AES ministerial session in Dakar on 17 October 2026 agreed only to set up working groups toward a framework agreement, while trade with the three states grew in 2025 (press). For a Moroccan exporter, Tanger Med's 2026 figure, due early in 2027, will show whether the Suez return redistributes Mediterranean transshipment. The BCEAO held its rate while Senegal's bonds traded near 50 cents: zone-wide readings must be paired with country readings.
What a board should ask
The test before commitment
The dashboard is itself the test, and it sits in the Diagnose step of the STREDGE Evidence-to-Decision Cycle. A named person records the twenty readings on the last Friday of March, June, September and December 2027, with definition, source address and value in a data file; compares each against its threshold; applies the rule printed above; and sends the executive committee one paragraph with one of three verdicts: no shift; shift to a named scenario, with the chapters it reopens; or mixed, re-read in one month. The frame is built to survive Scenario 2, the quarter in which trade and energy rows cross together and the committee is most tempted to act on a headline; it is a reading frame, not a scored instrument. The verdict on the frame itself, taken once before the first quarterly reading: deploy, when the rows map to at least five decisions already taken for 2027 and a named owner is in place; rethink, when the rows touch fewer than five decisions, in which case they are replaced by the company's own equivalents at the same thresholds; keep testing, when two quarters of readings are needed before any decision is tied to a crossing; stop, when the company's exposures are so domestic and short-cycle that no row would change what it authorises. The number the evidence does not contain is the company's own exposure weight on each row, which no public series supplies.
What to instrument: landed cost per container on the largest lane against row 6; energy cost per unit of output against rows 7 and 10; order-book cover in weeks against row 19; days sales outstanding on Senegalese receivables against row 14; the share of volume on Sahel-bound corridors against row 15.
- Which three of the twenty rows, if crossed, would change a decision we have already taken for 2027, and who here reads them?
- What did our 2026 plan assume for Brent, freight and the ECB rate, and when did we last set the assumption beside the reading?
- If Senegal's creditors sign no agreement by the end of June 2027, which of our receivables, contracts and bank lines does that touch?
- Which of our own numbers moved first in 2026: price, orders or cash?
Evidence cards
CH06-C1SEG-1for the readings; SEG-0 for the regime labelThe environment entering 2027 is an energy shock on a managed trade rivalry.
- Context
- EIA Short-Term Energy Outlook of 6 October 2026 (September average an estimate; forecasts are projections) and daily spot table released 15 October 2026; gas front month from a static secondary price page (20 October 2026) and press (2 and 5 October 2026); storage from the regulator's data item (1 April 2026) and the operators' platform (status 20 October 2026); Budget Lab reading of 24 August 2026; Global Trade Alert thread count of 20 October 2026; IMF World Economic Outlook of 13 October 2026 and July 2026 update (projections).
- Contradictory evidence
- the trade rows sit inside their bands; row 7 is above its line on the September monthly average and the October daily readings against a quarterly threshold, while row 10 sits inside its band; the regime label is the chapter's reading of the cluster, not a tested finding.
- Review date
- 21 October 2026.
CH06-C2SEG-1Both reserve-currency central banks raised rates in September 2026; the BCEAO and Bank Al-Maghrib held.
- Context
- ECB decision of 10 September 2026 and account of 8 October 2026; FOMC statement and implementation note of 16 September 2026; BCEAO communiqué of 9 September 2026; Bank Al-Maghrib decision of 22 September 2026 read through two press reports (the bank's site returned an error).
- Contradictory evidence
- the ECB pre-commits to no rate path and Bank Al-Maghrib decides meeting by meeting (press), so neither the rises nor the holds fix the next decision; the Fed's rise is its only move of 2026 so far.
- Causal confidence
- the ECB's statement links its decision to the conflict; whether a tightening cycle has begun is not established.
- Review date
- 21 October 2026.
CH06-C3SEG-1for the readings; SEG-0 for the lagActivity fell below 50 after the March price jump and stood above 50 in September while prices rose and orders fell; activity lags price.
- Context
- S&P Global euro area and France releases of 1 and 5 October 2026 (September data); monthly composite finals January 2025 to September 2026 (HCOB, then S&P Global releases) and EIA monthly Brent (release of 15 October 2026), read 21 October 2026; BCEAO communiqué of 9 September 2026 (second-quarter growth and inflation).
- Contradictory evidence
- a 41-month high in the composite index is consistent with a durable expansion; the lag is the chapter's reading, supported by the surveys' own order and price commentary.
- Review date
- 21 October 2026.
CH06-C4SEG-1Text-based indices are attention gauges; the geopolitical risk index revised a daily value within a week.
- Context
- ECB Economic Bulletin 2/2026 box (adjusted trade policy uncertainty measure, growth effect from a Bayesian VAR, 1999 to 2025); FRED series for the World Uncertainty Index updated 15 October 2026; GPR and TPU monthly spreadsheets (updated 1 October 2026, read 21 October); third-party mirror readings of 20 and 21 October 2026 (provisional); Caldara and Iacoviello (2022) for the investment finding; one economist's June 2026 reading of the new indices.
- Contradictory evidence
- the geopolitical risk index's authors report that it "foreshadows lower investment and employment", and the ECB associates the 2025 rise in trade policy uncertainty with about 0.3 percentage points less euro area growth, more on the unadjusted measure; both tie the indices to activity, not attention alone.
- Review date
- 21 October 2026.
CH06-C5SEG-1Three definitions of the US tariff rate give three readings.
- Context
- Budget Lab publications of 2 and 8 April, 20 and 24 July and 24 August 2026.
- Contradictory evidence
- none found in the sources read.
- Review date
- 21 October 2026.
CH06-C6SEG-1for the readings; SEG-0 for the co-movementIncident counts can fall while severity rises; the Suez, freight and price rows move together.
- Context
- ICC International Maritime Bureau report of 15 October 2026; shipowners' association figures of 16 October 2026 and liner-analyst expectation of 14 October 2026, both via press; freight-index compiler's commentary of 8 October 2026 via a secondary page; IMF PortWatch daily chokepoint transits to 18 October 2026.
- Contradictory evidence
- the shipowners' association notes that the Suez return coincides with Asian port congestion, so the net supply-demand effect "is not yet clear".
- Review date
- 21 October 2026.
CH06-C7SEG-1Senegal's restructuring, Ivorian and Moroccan issuance, and the ECOWAS-AES talks are the arena's sharpest readings.
- Context
- Agence Ecofin (16 and 19 October 2026, press); Zawya (11 September 2026, press); Rio Times (14 October 2026, press); Daba Finance and Le360 Afrique with AFP (19 February 2026, press) relaying the Ivorian finance ministry; Moroccan Ministry of Economy and Finance communiqué of 19 May 2026; Togolese government portal (15 October 2026); Tanger Med Port Authority release of 2 February 2026; Le360 Afrique with AFP (21 September 2026, press) for Lomé; African Eurobonds indicative closes of 19 and 20 October 2026 (aggregator), yields computed by the edition.
- Contradictory evidence
- Senegal's bond prices are a market reading, not an outcome; the October yields rest on indicative closes, not traded quotes.
- Review date
- 21 October 2026.
The readings in the signpost table that carry no claim tag (rows 6, 8, 9, 11, 12, 16, 18 and 20) are SEG-1 readings from the sources named in the table and in the sources paragraph: the freight index via a secondary page (15 October 2026); London Metal Exchange pages (20 October 2026, day-delayed); aggregator pages for lithium and allowances (20 October 2026); IEA, Key Questions on Energy and AI (16 April 2026; the 2025 figure an estimate, 2030 a projection); ECB reference rates; Regulation (EU) 2025/2083, the Commission's price page of 5 October 2026 and Implementing Regulation (EU) 2025/2548; the port authority release of 2 February 2026 and press for Lomé; the Census Bureau's national survey file (updated 8 October 2026).
CH06-H1 to H3SEG-0Hypotheses for 2027.
Falsification conditions stated above; scenario mapping stated in each.
Sources and limitations
Sources read on 20 and 21 October 2026. U.S. Energy Information Administration, Short-Term Energy Outlook (6 October 2026) and daily spot price table (release of 15 October 2026); oEnergetice.cz price page (20 October 2026, secondary); SoldiOnline (2 and 5 October 2026, press); AleaSoft (2026, secondary); ACER, CHEST data item 1122 (updated 22 April 2026); Argus Media (16 April 2026, press); Gas Infrastructure Europe, AGSI platform (status 20 October 2026); IMF PortWatch, daily chokepoint data (to 18 October 2026); The Budget Lab at Yale, The State of U.S. Tariffs (24 July and 24 August 2026), Improvements to the Budget Lab Tariff Model (20 July 2026), One Year of Tariff Analysis (2 April 2026) and the publication of 8 April 2026; Global Trade Alert, threads (20 October 2026), September 2026 roundup (5 October 2026) and activity tracker; International Monetary Fund, World Economic Outlook (13 October 2026) and July 2026 update, and the Senegal, Côte d'Ivoire and Morocco country pages; European Central Bank, monetary policy decisions (10 September 2026), account of the meeting (8 October 2026), schedule of meetings, key interest rates, euro reference rates (20 and 16 October 2026) and Economic Bulletin 2/2026 box (30 March 2026); Board of Governors of the Federal Reserve System, FOMC statement and implementation note (16 September 2026), meeting calendars and open market operations table; BCEAO, communiqués of 9 September and 2 October 2026 and policy-rate page; TelQuel and Le Matin (22 September 2026, press) on Bank Al-Maghrib; S&P Global, PMI releases of 1 and 5 October 2026 and release calendar; HCOB and S&P Global, euro area composite PMI final releases, January 2025 to September 2026; World Bank, Commodity Markets Pink Sheet, April 2025 to October 2026 editions (Exhibit 6.1 only); Caldara and Iacoviello, GPR and TPU index pages and monthly spreadsheets (updated 1 and 19 October 2026; spreadsheets read 21 October) and "Measuring Geopolitical Risk" (American Economic Review, April 2022); Iacoviello and Tong, AI-GPR (2026); stock-marketdata.com GPR mirror (20 and 21 October 2026, secondary, provisional); Menzie Chinn, Econbrowser (June 2026); Ahir, Bloom and Furceri, World Uncertainty Index via FRED (updated 15 October 2026); ICC International Maritime Bureau (15 October 2026); BIMCO via Cyprus Shipping News (16 October 2026, press); Seatrade Maritime (14 October 2026, press); Drewry via IndexBox and forwarder.lk (8 and 17 October 2026, secondary); London Metal Exchange, copper and cobalt pages (20 October 2026); Sentisense (7 September 2026, press); Trading Economics, lithium and carbon pages (20 October 2026, aggregator); IEA, Key Questions on Energy and AI (16 April 2026) and press release; EUR-Lex, Regulation (EU) 2025/2083; European Commission, DG TAXUD, price of CBAM certificates (5 October 2026) and Implementing Regulation (EU) 2025/2548; Direction générale du Trésor, principes et modalités de la coopération monétaire (25 May 2021); Agence Ecofin (16 and 19 October 2026, press); Zawya (11 September 2026, press); The Rio Times (14 October 2026, press); African Eurobonds, indicative closing prices (19 and 20 October 2026, aggregator); Daba Finance via AllAfrica and Le360 Afrique with AFP (19 February 2026, press); Ministère de l'Économie et des Finances du Maroc, communiqué (19 May 2026); Republic of Togo portal (15 October 2026); Tanger Med Port Authority (2 February 2026); Port Autonome de Lomé, Pilotine no. 039 (2025); Le360 Afrique with AFP (21 September 2026, press); U.S. Census Bureau, Business Trends and Outlook Survey, national data file (updated 8 October 2026); Tetlock, Expert Political Judgment (Princeton, 2005 and 2017); World Economic Forum, Global Risks Report 2026 (14 January 2026). Prior art declared here and not in the body: Eurasia Group, Top Risks 2026 (5 January 2026, analyst-based); Control Risks, RiskMap 2027 (due 10 November 2026, analyst-based); Economist Intelligence Unit, Risk Briefing (method read from a 2013 brochure hosted by a reseller: 66 indicators across ten categories scored 0 to 100; how analysts assign probability and impact is not explained).
Limitations. The geopolitical risk and trade policy uncertainty values were read from the authors' spreadsheets on 21 October 2026. The Global Trade Alert thread table sat behind a human check on 21 October and its year-to-date harmful count was not readable; the 445 count is the last readable reading, so row 2 has no quarterly count. Bank Al-Maghrib's decision rests on two press reports because the bank's site returned an error. Lomé's 2025 throughput is a port ranking relayed by press, not a port authority release. No traded Eurobond yield was found; row 14's yields are the edition's calculation from an aggregator's indicative closing prices, and for a bond trading near 50 the yield says less than the price. The gas front-month and the lithium and allowance prices come from secondary or aggregator pages, not from the exchange. The IMF's transit data count ships and deadweight, not TEU, so they cross-check row 5 rather than replace it. Row 20's lower line would have been met in spring 2026, with four periods at 19.1 to 19.8 percent to mid May, and was reversed by October; the threshold is kept and the episode is logged for the retrospective. Row 19's euro area line would have been met in April and May 2026, at 48.8 and 48.5, before the index returned to 50.0 in June; it is kept and logged on the same terms. The October flash surveys were not out on the access date. The 2013 brochure is the only method note found for the publisher whose reports feed row 17. The scenario rule and every threshold are the edition's judgment, graded SEG-0.
Exhibits for the web edition: Exhibit 6.3, one rate, three definitions (Budget Lab, July and August 2026); Exhibit 6.2, the World Uncertainty Index simple average, selected quarters from the fourth quarter of 2024 to the third quarter of 2026 (FRED); the twenty-row table above as a downloadable data file with definitions, source addresses and dates.
Corrections and challenges: through the channel on this page; logged with their dates.
Download the PDFs
The full edition, the executive summary and the eleven parts are free to download. Leave your work email and the files open on this page.