
Global Strategic Outlook 2027 · Chapter 3 of 10
Chapter 3. Two chokepoint shocks in one year, and buffers already unwound
Which single points of failure to remove in 2027, at what cost of carry.
Bruno Hounkpati, Founding Partner and Chief Executive Officer
20 October 2026
Chapter 3
Two chokepoint shocks in one year, and buffers already unwound: which single points of failure to remove in 2027, at what cost of carry
Container lines halted Hormuz transits at the end of February, the Red Sea coast changed hands in September, and firms had already shed their 2022 stock. The 2027 decision is which exposure to remove and what carrying cost to accept, not whether to hold more.
- The decision: which two or three single points of failure the company removes in 2027 and what it pays to remove them, inside the window between the fourth-quarter 2026 inventory budget and the first-half 2027 carrier renewals; owner, the chief operating officer with the chief financial officer.
- What the evidence says: 36 percent of the container capacity routed through Suez or around the Cape is back through Suez while general war-risk quotations sit at 0.2 to 0.3 percent of hull value; container lines halted Hormuz transits in the same year; Panama faces a new drought cycle; the one series that measures stock directly shows buffers unwound.
- The test: a single-point-of-failure map, then the cost-of-carry arithmetic under three freight cases and a 2024-scale closure, built to survive Scenario 2. The number the evidence lacks: the company's own cargo and business-interruption quotations.
Decision at stake
The decision window is the inventory budget round of the fourth quarter of 2026 and the carrier renewals of the first half of 2027, the cycle on which this chapter assumes most Asia-to-Europe contracts run. Inside that window the chief operating officer of a company of 30 to 500 million euros of revenue will decide, with the chief financial officer, which two or three single points of failure the company removes in 2027 and what it pays to remove them. The failure points are a sole carrier, a sole corridor to a landlocked market, a sole supplier two tiers down, a shared software vendor, or the company's own information estate. The costs of carry are weeks of safety stock at today's interest and freight rates, a dual-source price premium, or the unit-cost difference of producing nearer. In 2026 a single carrier relationship transmitted one chokepoint halt and three routing changes, inside nine months, to the importers on the lanes concerned.
What the evidence shows
What changed, 2024 to 2026
Measured by its share of Suez-or-Cape capacity, the Red Sea came less than half-way back, under a worse security picture. In early October 2026, 36 percent of the container capacity routed either through Suez or around the Cape went through the canal, against 8 percent between 2024 and mid-2026 and about 80 percent before the attacks began. The canal counted 1,228 transits of cargo vessels over 10,000 deadweight tonnes in September 2026, the busiest month since December 2023 and still 39 percent below pre-crisis levels. The insurance market reads the risk as selective rather than general: in late September 2026 war-risk quotations stood at about 3 percent of hull value for Saudi-linked tanker calls at Yanbu and up to 7 percent for calls further south at Jizan, but at only 0.2 to 0.3 percent for vessels transiting the Red Sea without a Saudi connection, at or below the 0.3 percent at which the arithmetic published by the freight-index compiler says the Suez saving disappears and well below the 1 percent at which the Cape becomes cheaper. After the Joint War Committee moved its line north on 29 July 2026, in the second week of September the Houthis took Mocha and Perim island, completing control of Yemen's Red Sea coast some twenty kilometres from the African shore. The carriers are back for the lanes the insurers price as safe; the coast they pass is not. CH03-C1
Back in part: share of Suez-or-Cape container capacity routed through Suez rather than the Cape
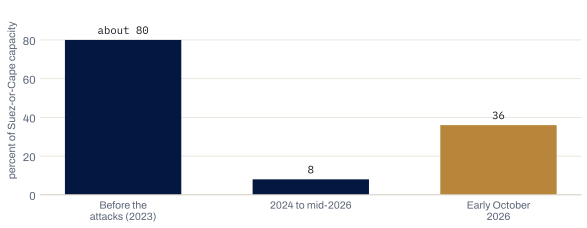
Weekly container capacity through Suez averaged 753,000 twenty-foot units in the first two weeks of October 2026 against 1.457 million in the same weeks of 2023.
Source · shipping-research estimates via Sourcing Journal (14 Oct 2026, press) and Lloyd's List Intelligence · read 2026-10-20 · SEG-1
Show the underlying numbers
| Item | percent of Suez-or-Cape capacity |
|---|---|
| Before the attacks (2023) | about 80 |
| 2024 to mid-2026 | 8 |
| Early October 2026 | 36 |
The insurers price the risk selectively: Red Sea war-risk quotations, late September 2026
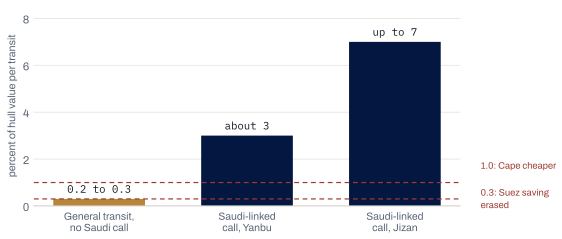
Market quotations read through press, not published tariffs; no October 2026 quotation was found.
Source · Reuters via Insurance Journal (30 Jul 2026) and ShipUniverse (25 Sep 2026), press; thresholds per the freight-index compiler's arithmetic · read 2026-10-20 · SEG-1
Show the underlying numbers
| Item | percent of hull value per transit |
|---|---|
| General transit, no Saudi call | 0.2 to 0.3 |
| Saudi-linked call, Yanbu | about 3 |
| Saudi-linked call, Jizan | up to 7 |
The carriers are back for the lanes the insurers price as safe; the coast they pass is not.
Hormuz was halted in the same year. After the American and Israeli strikes on Iran at the end of February 2026, container lines halted transits of the Strait, through which about 11 percent of maritime trade and more than a third of seaborne oil exports pass; about 170 container ships, around 450,000 twenty-foot units, were inside the Gulf facing exit restrictions, and the Cape route was absorbing about 2.5 million twenty-foot units of capacity. CH03-C2
Panama faces a new drought cycle. After a 2025 fiscal year of 13,404 transits, up 19.3 percent, on 24 July 2026 the maximum draft for the largest locks was cut to 49 feet as Gatun Lake fell, with the canal's own estimate of a severe El Niño rising from 25 percent in April to 81 percent in July; carriers announced surcharges of 100 to 320 dollars per twenty-foot unit from July and August 2026. CH03-C3
Freight is elevated and falling on the Asia-to-Europe lane, and very high across the Pacific. The composite World Container Index stood at 4,485 dollars per forty-foot container on 15 October 2026, up 3 percent after three weekly declines, with Shanghai to Rotterdam at 3,522 dollars and Shanghai to New York at 10,075. The Asia-to-North-Europe spot rate was 3,260 dollars per forty-foot unit on 6 October 2026, down from a July peak near 6,000 and against a December 2025 low of 2,467. CH03-C4
On the one series that measures stock directly, buffers were unwound. The American ratio of business inventories to sales fell from 1.40 in August 2025 to 1.33 in August 2026. In France, 11 percent of industrial firms reported supply difficulties in September 2026 in the Banque de France's monthly survey of about 8,500 firms, broadly stable, with the level near 20 percent in aeronautics, intensification in electronics and electrical equipment, and finished-goods inventories rising slightly, mainly in food processing, ahead of expected price rises, and in aeronautics, under ramp-up strain. CH03-C5
Diversification is an intention in surveys and not an outcome in trade data. In 2023, 74 percent of leading euro-area companies surveyed by the European Central Bank said they expected to near-shore, diversify or friend-shore production within five years; in 2025 China supplied 22.3 percent of the Union's imports from outside the bloc and imports from China rose 6.4 percent. CH03-C6
Port performance in the francophone African arena is diverging. The Container Port Performance Index for 2025, released on 10 June 2026 and measuring total vessel time in port across 400 ports, places Tanger Med sixth in the world with a score of 134, Dakar 144th with a score of 10, Lomé 347th, Tema 376th, Abidjan 381st at minus 127.5 and Conakry 399th at minus 275.9. Volumes run the other way: Tanger Med handled 11,106,164 twenty-foot units in 2025, up 8.4 percent; Abidjan handled 46.6 million tonnes, up 16.1 percent, and 1,697,131 units, up 3.1 percent, with hinterland transit of 3.92 million tonnes, up 34 percent, of which 2.40 million to Burkina Faso and 1.47 million to Mali, up from 835,216 tonnes in 2024; Lomé handled 2.4 million units, up 16 percent, two thirds of its 2024 tonnage being transhipment. Morocco and Cameroon are among the 24 states trading under gazetted schedules of the African Continental Free Trade Area; Côte d'Ivoire, Senegal, Togo, Guinea and Benin are not. CH03-C7
What is contested
The claim this chapter most expects to hear is that the chokepoint problem is ending and the 2024 buffers are dead cost. The disconfirming search gives a partial answer: carriers are returning on lanes the insurers now price at 0.2 to 0.3 percent, while, on the trade-press account of 14 October, Asia-to-Europe rates had fallen for thirteen consecutive weeks and shorter transits release capacity the carriers need to deploy; the freight-index compiler's own analyst is quoted saying the security case "has arguably moved in the wrong direction", and the premium on any Saudi-linked call shows how fast the price of a lane can move when a flag or a port of call changes.
The second claim is that redundancy pays. In a 64-country model of the pandemic, renationalising supply chains did not raise resilience because domestic inputs were disrupted by domestic lockdowns; under systemic shocks the resilient configuration differs from the just-in-case answer to idiosyncratic risk; and where demand becomes more price-elastic, private spending on resilience can exceed what is efficient, a condition under which a second source never used may cost more than the risk it covers. Across 885 publicly announced supply-chain glitches at listed firms, operating income fell 107 percent and return on sales 114 percent against controls in the year before the announcement, with no recovery in the two years after; the cost of a disruption is well measured, the return on preventing one is not. No study found measures a resilience premium, or a cost of redundancy, for firms of 30 to 500 million euros. CH03-C9
The third claim is that diversification from China is under way. At the first tier, perhaps: 78 percent of the 140 supply-chain and risk leaders at large French and European industrial groups surveyed for the January 2026 supply-chain risk barometer (press summaries of the barometer) called dual sourcing a top priority for 2026, and no comparable survey of mid-sized French companies with a sourcing question was found. CH03-C9
The corridor
What we expect in 2027
First, the share of Suez-or-Cape container capacity routed through Suez does not exceed 60 percent for three consecutive months in 2027, and at least one month in 2027 sees general Red Sea transit quotations back above 1 percent of hull value; the Cape detour remains partial because the lane is re-priced at least once. Falsified if the Suez share exceeds 60 percent for a full quarter, or if general transit quotations stay at or below 1 percent in every month of 2027. Stress-case hypothesis (Scenario 2). CH03-H1
Second, Asia-to-North-Europe spot rates stay between 2,500 and 5,000 dollars per forty-foot unit through 2027, a band in which, for goods of ordinary value density, safety stock rather than nearer production is likely to be the lower-cost hedge for importers in francophone Europe; the Simulate step below tests it product family by product family. Falsified by weekly readings outside that band for one full quarter. Baseline hypothesis (Scenario 1). CH03-H2
Third, French industrial firms reporting supply difficulties stay below 15 percent across industry, with aeronautics and electronics expected to be the only sectors adding buffers on purpose. Falsified by two consecutive monthly readings above 20 percent, or by finished-goods stocks rising in a third sector for two consecutive months. Baseline hypothesis (Scenario 1). CH03-H3
Signposts
| Indicator | Definition fixed | Reading, date | Threshold | Crossing means |
|---|---|---|---|---|
| Container capacity via Suez | share of Suez-or-Cape capacity, weekly, shipping-research estimates via trade press | 36 percent, early October 2026 | above 60 percent for three months; or below 20 | the detour is over and transit buffers weaken; or a renewed closure justifies 2024 buffer levels |
| Red Sea war-risk quotation, general transit (no Saudi call) | percent of hull value per transit, insurer quotations via press | 0.2 to 0.3 percent, late September 2026 (Saudi-linked calls 3 percent at Yanbu, up to 7 at Jizan) | above 1 percent (Cape-routing threshold); 0.3 percent erases the Suez saving | the lane has been re-priced and the detour returns for the ships it covers |
| Suez monthly transits over 10,000 dwt | Lloyd's List Intelligence, fortnightly | 1,228, September 2026 | above 1,700; or below 1,000 | normalisation; or a 2024-scale reversal |
| World Container Index composite; Asia-to-North-Europe spot | World Container Index, weekly; Freightos Baltic Index, weekly | 4,485 dollars; 3,260 dollars (October 2026) | above 5,000 per forty-foot unit; or below 2,500 | freight is again the dominant landed-cost risk; or buffer stock is the cheaper hedge |
| American inventories-to-sales ratio | Census, monthly, seasonally adjusted | 1.33, August 2026 | above 1.40 for two quarters; or below 1.30 | large buyers are rebuilding buffers; or the episode has fully unwound |
| French industrial firms reporting supply difficulties | Banque de France monthly survey, about 8,500 firms | 11 percent, September 2026 | above 20 percent for two months; or below 8 | general redundancy is justified; or confine it to named sectors |
The two arenas
Francophone Europe. The Marseille-based carrier is the clearest case: it announced in December 2025 that its Asia-to-North-Europe loop would return through Suez from 5 January 2026 after four test transits, suspended all Suez transits at the end of February when container lines halted Hormuz transits, set the highest of the three Panama surcharges in July (320 dollars per twenty-foot unit, on its transpacific strings), and had recorded 199 canal transits since 1 January by 18 August, against 212 for the whole of 2025, and 60 in September alone. The French aeronautics tier is the clearest sector adding buffers deliberately, at about 20 percent of firms reporting difficulties against 11 for industry. The ransomware incident of 19 September 2025 on an aerospace group's shared passenger-processing software, disclosed in a securities filing on 24 September and reported as disrupting Brussels, Heathrow, Berlin and Dublin at once, shows the pattern for logistics information systems: one vendor as a single point of failure across several national gateways. The other kind of failure, inside the company's own estate, has a price on the record: a British carmaker's cyberattack of 2 September 2025 paused production for five weeks and booked 196 million pounds of exceptional cyber-response cost in a quarter in which revenue fell 24 percent and a 398 million pound profit became a 485 million pound loss before tax and exceptional items. CH03-C8
Francophone Africa. Tanger Med is the only node in the arena that combines a top-ten vessel turnaround, eleven million units of volume and preferential status under the continental free-trade area, which makes it the default candidate for a buffer-stock or nearer-production node between Europe and West Africa, with two caveats: most of its volume is transhipment rather than Moroccan trade, and none of Côte d'Ivoire, Senegal, Togo, Guinea or Benin yet trades under gazetted schedules, so the preference cannot be used on goods bound for them. Abidjan is the opposite case for a company serving Burkina Faso or Mali: a gateway whose hinterland transit grew 34 percent in 2025, Mali-bound transit 76 percent (no other gateway's 2025 transit growth was found) and among the slowest by vessel turnaround (381st of 400; Conakry is 399th), with no gazetted continental schedule, which argues for a second corridor through Lomé or Tema as a hedge rather than for stock alone, while noting that Lomé's own turnaround ranks 347th and Tema's 376th, and that the index measures a ship's time in port, not the days or the landed cost to Ouagadougou or Bamako. Dakar ranks 144th on the index, its director general said in November 2025 that nearly 65 percent of Mali's transit passes through it (press), and Ndayane's dredging to 20 metres finished on 27 July 2026 against delivery due in the third quarter of 2028 (press, a projection).
What a board should ask
The test before commitment
The test runs in two steps of the STREDGE Evidence-to-Decision Cycle. In the Diagnose step, a single-point-of-failure map that names, for each product family, the carrier, the corridor, the port, the second-tier supplier, the software vendor and the internal system whose loss would stop shipments, and the weeks of cover held against each. In the Simulate step, a cost-of-carry comparison for the two largest exposures, with the arithmetic written out: weeks of cover, times landed cost, times the annual carrying rate (interest, storage and obsolescence), set against the dual-source premium times annual volume, set against the unit-cost gap of the nearer site times annual volume; each run under three freight cases (2,500, 3,500 and 5,000 dollars per forty-foot unit; the middle case is an assumption, the other two are the signpost thresholds) and under a 2024-scale closure. The test is designed to survive Scenario 2; under Scenario 1 the deploy verdict for safety stock must still hold at the 2,500 dollar case. The verdicts: deploy, when one lever dominates in all three cases; rethink, when the ranking flips with freight; keep testing, when the second-tier exposure is unknown; stop, when the exposure is cheaper to insure than to remove, a verdict that needs the company's own cargo and business-interruption quotations, which this chapter cannot supply.
What to instrument: the share of volume moved under a single carrier contract; the number of product families with a single corridor to their largest market; the weeks of cover held against each named failure point and their carrying cost at the current rate; the number of second-tier suppliers actually identified; the recovery time, measured, from the last information-systems incident.
- Which one counterparty transmitted the most disruption to us in 2026, and what does it cost to have two?
- For our Sahel-bound goods, which port and which border do we depend on, and what is the second route's vessel time in port?
- Did we unwind our 2022 buffers, and if freight returned to 6,000 dollars tomorrow, what is the first customer we would fail?
- Who owns the recovery of our own systems, and when was it last rehearsed?
Evidence cards
CH03-C1SEG-1The Red Sea return is partial; insurers price the risk selectively; the coast has changed hands.
- Context
- Suez and Bab el-Mandeb transit counts (September 2026), routing shares (early October 2026; weekly Suez container capacity averaged 753,000 twenty-foot units in the first two weeks of October against 1.457 million in the same weeks of 2023), war-risk quotations of late July and late September 2026 (Reuters via trade press; market quotations, not published tariffs), events of September 2026.
- Contradictory evidence
- general transit quotations at or below the 0.3 percent threshold support the carriers' return; no October 2026 quotation was found.
- Review date
- 20 October 2026.
CH03-C2SEG-1single press source, undatedContainer lines halted Hormuz transits after the strikes of late February 2026.
- Context
- Lloyd's List report, undated page describing 28 February to 1 March 2026; UNCTAD shares for the Strait's weight in maritime trade.
- Contradictory evidence
- none found in the sources read.
- Review date
- 20 October 2026.
CH03-C3SEG-1Panama's 2025 transit growth preceded renewed draft restrictions.
- Context
- Autoridad del Canal de Panamá, 8 October 2025 (preliminary, unaudited: 13,404 transits, up 19.3 percent; revenue 5.7 billion balboas); trade press citing the Authority, 27 July 2026.
- Contradictory evidence
- traffic still rose between October 2025 and June 2026, to 10,726 vessels (up 5.2 percent), before the draft cut.
- Review date
- 20 October 2026.
CH03-C4SEG-1Freight elevated and falling on Asia-to-Europe, very high transpacific.
- Context
- index readings of 6 and 15 October 2026 against July 2026 and the lowest December 2025 reading found.
- Contradictory evidence
- the composite rose 3 percent in the week to 15 October 2026 after three weekly declines, Shanghai to Rotterdam by 6 percent.
- Review date
- 20 October 2026.
CH03-C5SEG-1Buffers unwound on the American ratio; French difficulties stable at one firm in nine.
- Context
- Census (August 2026, released 15 October 2026); Banque de France (survey of 27 September to 5 October 2026).
- Contradictory evidence
- the same survey reports finished-goods inventories rising slightly, mainly in food processing and aeronautics.
- Transferability
- no inventory series comparable to the American ratio was found for France or for francophone Africa; the Banque de France survey measures reported difficulties, not stock.
- Review date
- 20 October 2026.
CH03-C6SEG-1Diversification is intended, not observed.
- Context
- ECB survey of 65 firms (July to August 2023); Eurostat 2025 trade.
- Contradictory evidence
- first-tier shifts may be real while second-tier inputs stay Chinese.
- Review date
- 20 October 2026.
CH03-C7SEG-1West African gateway performance diverges between turnaround and volume.
- Context
- index ranks and scores via two press summaries, which count 53 and 54 African ports respectively (the report annex was blocked; Lomé and Cotonou scores not found); Tanger Med Port Authority release of 2 February 2026; Abidjan 2025 figures from the Ivorian Ministry of Economy portal (17 February 2026); Dakar 2025 via press (21 April 2026: 29.66 million tonnes, 908,529 units); Ndayane per the operator's release (27 July 2026) and Le Soleil (17 September 2026, press, reporting the Prime Minister's meeting with the operator); Lomé 2025 units via press citing the Lloyd's List ranking and 2024 base from the port's newsletter; free-trade-area status per tralac (October 2026).
- Contradictory evidence
- the index measures a ship's time in port, not the days or the landed cost to Ouagadougou or Bamako, so a low rank need not mean a slower corridor.
- Review date
- 20 October 2026.
CH03-C8SEG-1Two documented single points of failure in logistics and manufacturing information systems, 2025.
- Context
- RTX Corporation Form 8-K of 24 September 2025 (event of 19 September; airports named by press, not in the filing); the carmaker's quarterly results of 14 November 2025 read through two press summaries that agree with each other; 196 million pounds is the exceptional cyber-response cost booked in the quarter, not the total cost of the incident.
- Contradictory evidence
- none found in the sources read.
- Transferability
- both are large companies; no documented case of this size for a firm of 30 to 500 million euros was found.
- Review date
- 20 October 2026.
CH03-C9SEG-1The resilience literature measures the cost of disruption, not the return on redundancy; first-tier dual sourcing is a stated priority at large French and European groups.
- Context
- Hendricks and Singhal (2005), abstract and companion study; NBER working papers 27224, 29345, 29330, 31820 and 31661; the January 2026 barometer (140 respondents, large companies, read through two press reports).
- Contradictory evidence
- none of these covers mid-sized European or African firms or the 2024 to 2026 chokepoint events.
- Review date
- 20 October 2026.
CH03-H1 to H3SEG-0Hypotheses for 2027.
Falsification conditions stated above; scenario mapping stated in each.
Sources and limitations
Sources read on 20 and 21 October 2026. UNCTAD, Review of Maritime Transport 2025, overview (24 September 2025) and chapter 1; Lloyd's List Intelligence, Red Sea Brief (15 October 2026) and transit updates (2024 data); Sourcing Journal via Yahoo Finance (14 October 2026, press, citing Clarksons, Reuters and Drewry); Lloyd's List (undated page on the Hormuz closure); gCaptain (10 August 2026, press); Al Jazeera (13 September 2026, press); Hellenic Shipping News, Egypt Today and Ports Europe (Suez Canal Authority figures via press, December 2025 to August 2026); Autoridad del Canal de Panamá (8 October 2025); FreshFruitPortal (27 July 2026, trade press); Drewry, World Container Index (15 October 2026); Freightos, weekly updates (22 September and 6 October 2026); Container News and Air Freight News (2025 readings, press); US Census Bureau, Manufacturing and Trade Inventories and Sales (15 October 2026); Banque de France, Enquête mensuelle de conjoncture, début octobre 2026 (12 October 2026); European Central Bank, Economic Bulletin 7/2023, box on supply-chain risks; Eurostat, International trade in goods; World Bank and S&P Global, Container Port Performance Index 2025 (publication page; results via Le360, 15 June 2026, and Ecofin Agency, 13 June 2026, press); Tanger Med Port Authority, Bilan de l'activité portuaire 2025 (2 February 2026); Port Autonome d'Abidjan, statistical pages; Côte d'Ivoire Ministère de l'Économie portal citing the Port Autonome d'Abidjan (17 February 2026); Ecofin Agency (21 April 2026 on Dakar, press); DP World, Ndayane dredging release (27 July 2026); Le Soleil (17 September 2026 and 20 November 2025, press); Port Autonome de Lomé, Pilotine no. 039 (2025); Le360 Afrique with AFP (21 September 2026, press); Modaes and Marine Insight (December 2025, press), Middle East Observer (23 August 2026, press) and Tradlinx citing Container News (25 September 2026, press) on carrier Suez transits; Insurance Journal (30 July 2026) and ShipUniverse (25 September 2026), press citing Reuters, on war-risk quotations; RTX Corporation, Form 8-K of 24 September 2025 (SEC EDGAR); press summaries of the carmaker's second-quarter results of 14 November 2025 (Jaguar Enthusiasts' Club; Just Auto via Yahoo Finance); KYU Associés, Baromètre des risques supply chain, sixth edition (January 2025, AMRAE-hosted) and seventh edition via DirectIndustry and Formes de Luxe (January 2026, press); Hendricks and Singhal (Management Science, 2005), abstract via an academic newsletter, and the companion stock-price study via Georgia Institute of Technology (2005); NBER Working Papers 27224, 29330, 29345, 31661, 31820; tralac, status of ratification (7 September 2026) and resource page (October 2026); AfCFTA Secretariat.
Limitations. The index report and annex were blocked to the reader used, so ranks and scores rest on two press summaries that disagree on the African port count; Lomé's, Tema's and Cotonou's scores were not found. The carrier-renewal cycle used for the decision window is the chapter's assumption, not a documented practice. Lomé's 2025 tonnage and transhipment share from the port itself, Abidjan's second-terminal throughput and Dakar's 2025 Malian transit tonnage were not found. UNCTAD's 2026 maritime review had not been published on the access date. The Hormuz figures rest on a single undated trade-press page. No survey of mid-sized French companies with a sourcing question was found; the January 2026 barometer covers large companies. War-risk quotations were read through press reports of Reuters rather than from an insurer or the Joint War Committee, and none was found for October 2026. The carmaker's figures rest on two press summaries of its results release that agree with each other. The resilience-premium literature covers listed companies and the 2020 shock; it does not cover mid-sized European or African firms or the 2024 to 2026 chokepoint events. Whether French and francophone African firms unwound their 2022 buffers is not measured by any series found; the chapter's statement rests on the American ratio.
Corrections and challenges: through the channel on this page; logged with their dates.
Download the PDFs
The full edition, the executive summary and the eleven parts are free to download. Leave your work email and the files open on this page.